Obesity trends 1985
When the CDC began their observations in 1985, 21 states participated. Those with the highest concentration of obese individuals were found in the eastern part of the country and did not exceed 14% of the entire population.

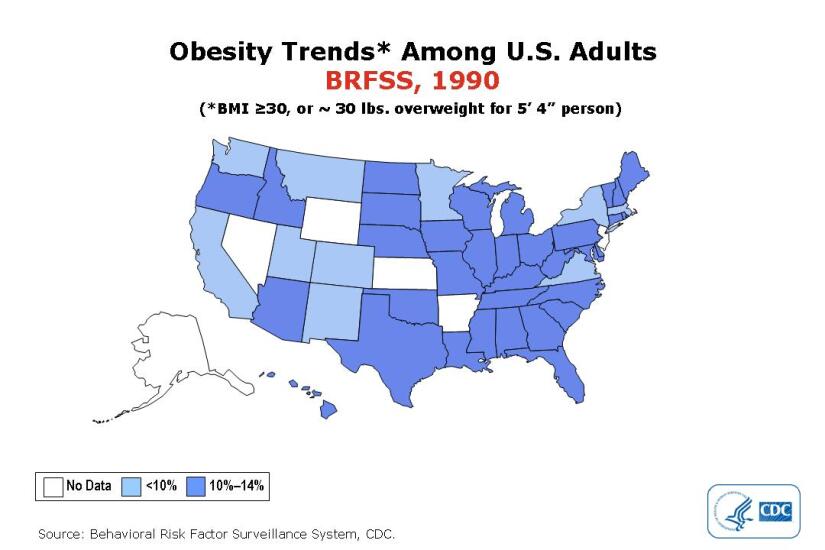
Obesity trends 1990
In 1990 ten states had a prevalence of obesity less than 10% and no states had prevalence equal to or greater than 15%, among states participating in the Behavioral Risk Factor Surveillance System.

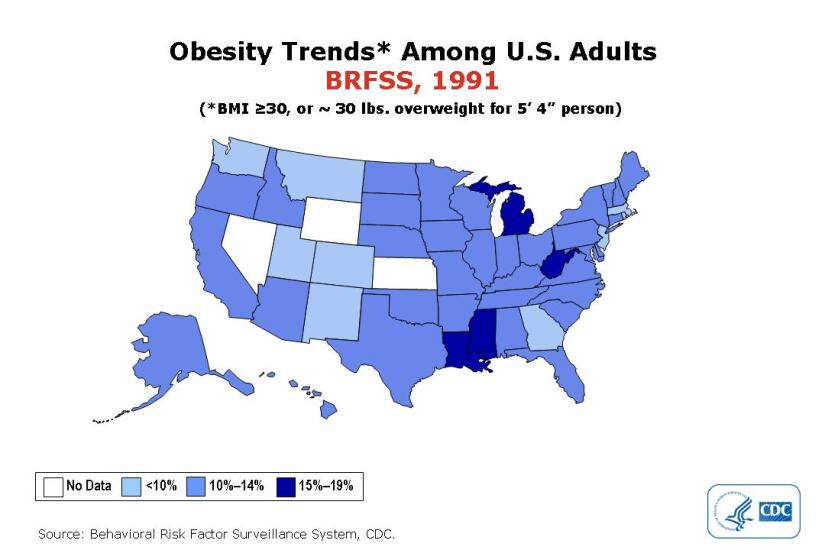
Obesity trends 1991
After four states advanced beyond the 14% high mark of previous years, in 1991 the CDC created a new category for those between 15% and 19%.

Obesity trends 1999
Since a new category for those states with over a 20% obese population was added in 1997 (Mississippi, Indiana, and Kentucky exceeded the 20% threshold), 15 more states were added to the tally. By 1999, no state had prevalence less than 10% and 18 states had a prevalence of obesity between 20-24%.

Obesity trends 2001
Mississippi, currently the fattest state in the country, burst through the 24% ceiling with over 25% of their citizens obese.

Obesity trends 2005
Once again, the CDC had to add another category for their measurement of the obese population in the United States. Mississippi, Louisiana, and West Virginia all exceeded previous limits. The most obese populations were clustered in the South East.

Obesity trends 2009
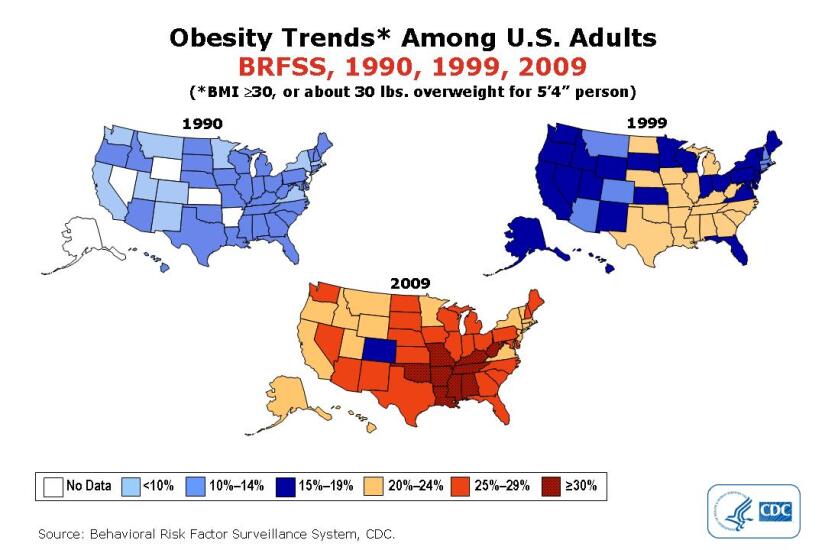
In 2009, only one state (Colorado) and the District of Columbia had a prevalence of obesity less than 20%. Thirty-three states had a prevalence equal to or greater than 25%; nine of these states (Alabama, Arkansas, Kentucky, Louisiana, Mississippi, Missouri, Oklahoma, Tennessee, and West Virginia) had a prevalence of obesity equal to or greater than 30%, calculates the CDC.

Overall obesity trends
Between 1985 and 2009 when the CDC measured the changes in adult obesity in the U.S., the rates have dramatically increased. As seen in this slide, some states increased their obese population by over 15 percentage points since 1990.


