
Introduction
To see part one,
EBA, in partnership with business intelligence data analytics firm
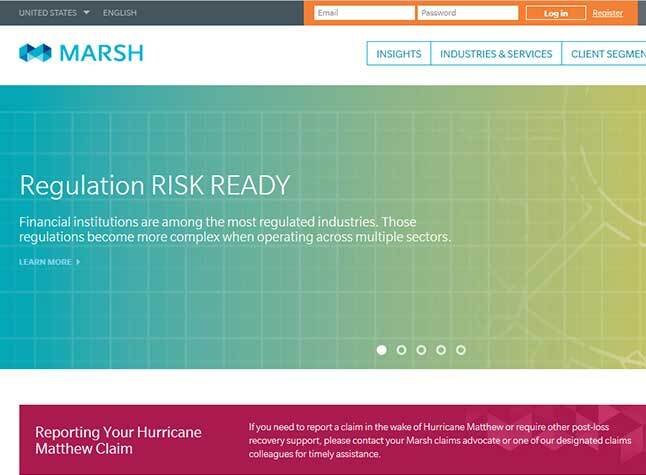
25) Marsh USA
Year-over-year growth: -2.87%
Same spot as 2015
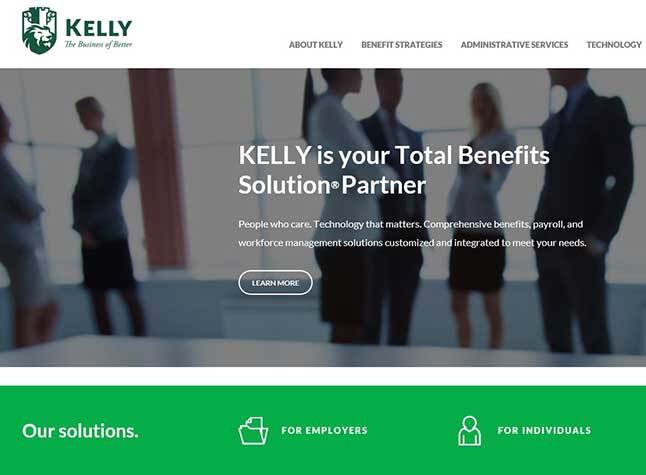
24) Kelly & Associates Insurance Group
Year-over-year growth: 8.53%
Up 2 spots from 2015

23) Woodruff-Sawyer & Company
Year-over-year growth: -5.86%
Down 1 spot from 2015
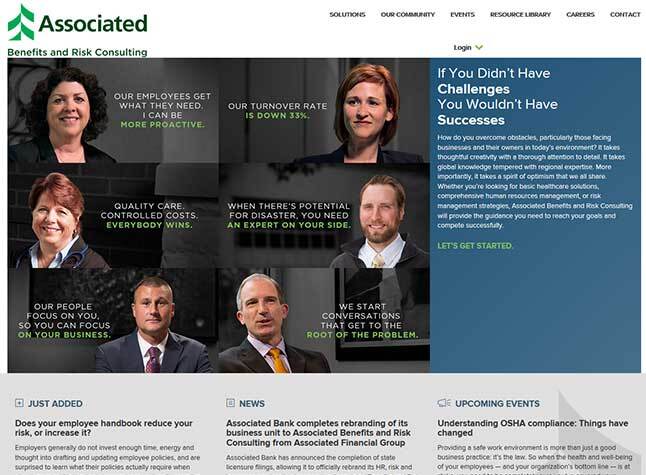
22) Associated Financial Group
Year-over-year growth: 25.77%
Up 8 spots from 2015
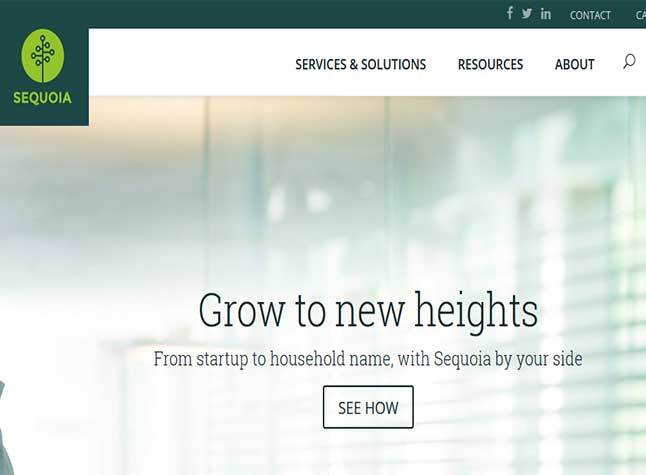
21) Sequoia Benefits
Year-over-year growth: -1.16%
Up 3 spots from 2015
20) Corporate Synergies Group
Year-over-year growth: 4.72%
Same spot as 2015
19) Holmes Murphy and Associates
Year-over-year growth: 5.74%
Same spot as 2015

18) AssuredPartners
Year-over-year growth: 8.59%
Same spot as 2015

17) OneDigital
Year-over-year growth: 6.76%
Same spot as 2015

16) CBIZ Benefits & Insurance Services
Year-over-year growth: 5.4%
Down 1 spot from 2015

15) EPIC
Year-over-year growth: 21.77%
Up 6 spots from 2015

14) Hays Group
Year-over-year growth: 14.25%
Up 2 spots from 2015

13) BB&T
Year-over-year growth: 18.3%
Same spot as 2015

12) Brown & Brown Insurance
Year-over-year growth: 30.35%
Same spot as 2015
11) NFP
Year-over-year growth: 8.32%
Same spot as 2015

10) Wells Fargo
Year-over-year growth: -8.34%
Down 2 spots from 2015

9) HUB International
Year-over-year growth: 20.96%
Up 1 spot from 2015

8) Alliant Insurance Services
Year-over-year growth: 16.35%
Up 1 spot from 2015

7) USI Insurance Services
Year-over-year growth: 11.12%
Same spot as 2015

6) Lockton Companies
Year-over-year growth: 3.62%
Same spot as 2015

5) Marsh & McLennan Agency
Year-over-year growth: 11.36%
Same spot as 2015

4) Aon Consulting
Year-over-year growth: 21.71%
Down 1 spot from 2015

3) Gallagher Benefit Services
Year-over-year growth: 3.51%
Down 1 spot from 2015

2) Willis Towers Watson
Year-over-year growth: 5.71%
Up 2 spots from 2015

1) Mercer Health & Benefits
Year-over-year growth: 6.7%
Same spot as 2015

2015 list
To see part one of the 2015 (No. 50-26) list,
To see part two of the 2015 (No. 26-1) list,


